Visa, Analytics Platform
Dig deeper.Decide faster.
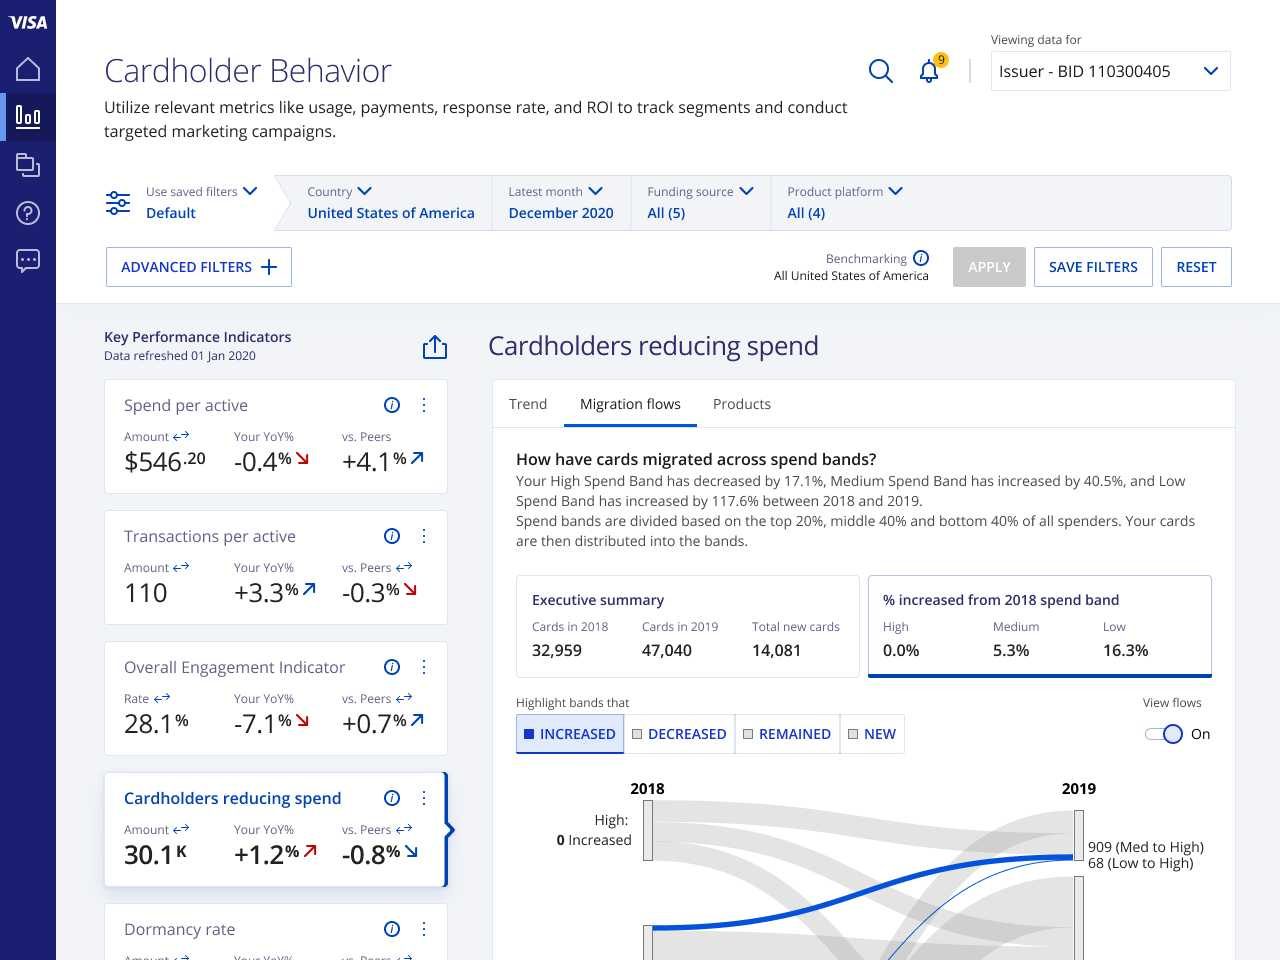
- Role
- Primary designer, end to end
- Users
- Analysts and executives at client banks
- Platform
- Web
- Timeline
- 2020–2022
Overview
- Problem
- Client banks’ reports were specialized and siloed, the data was hard to read, and real digging happened off-platform, so few people came back.
- Opportunity
- Visa gives client banks analytics on their own card programs. If analysts and executives worked in it, Visa’s data would drive their decisions.
- Solution
- Dashboards that help analysts find trends and executives make decisions: one page per question, with the context to trust the answer.
The result
One page per question, with the context to trust the answer.
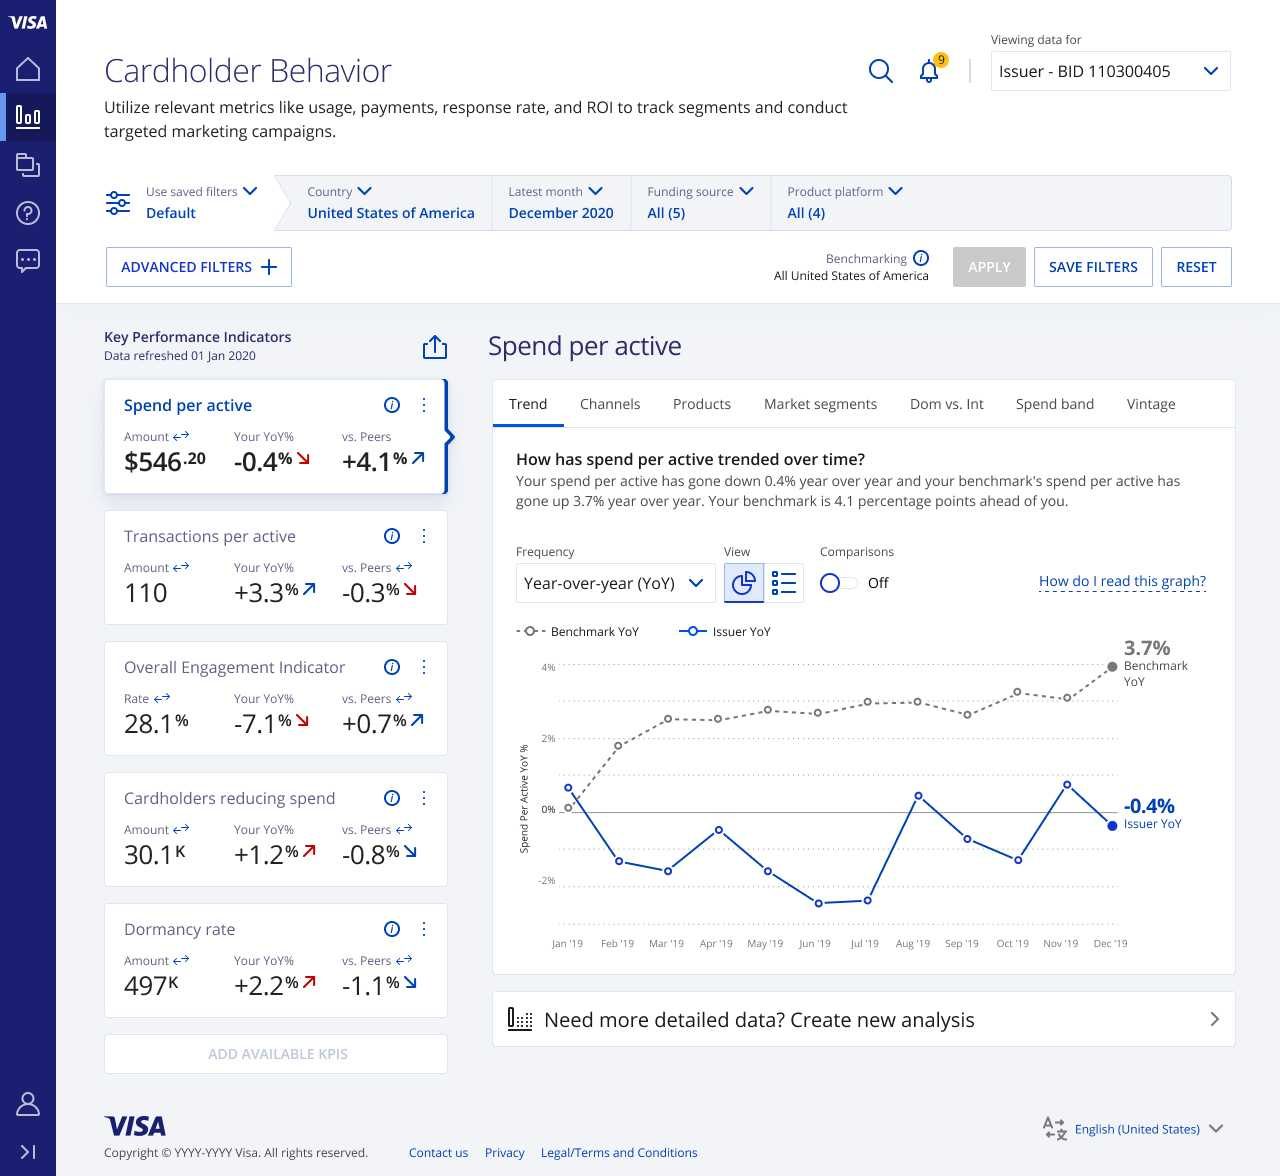
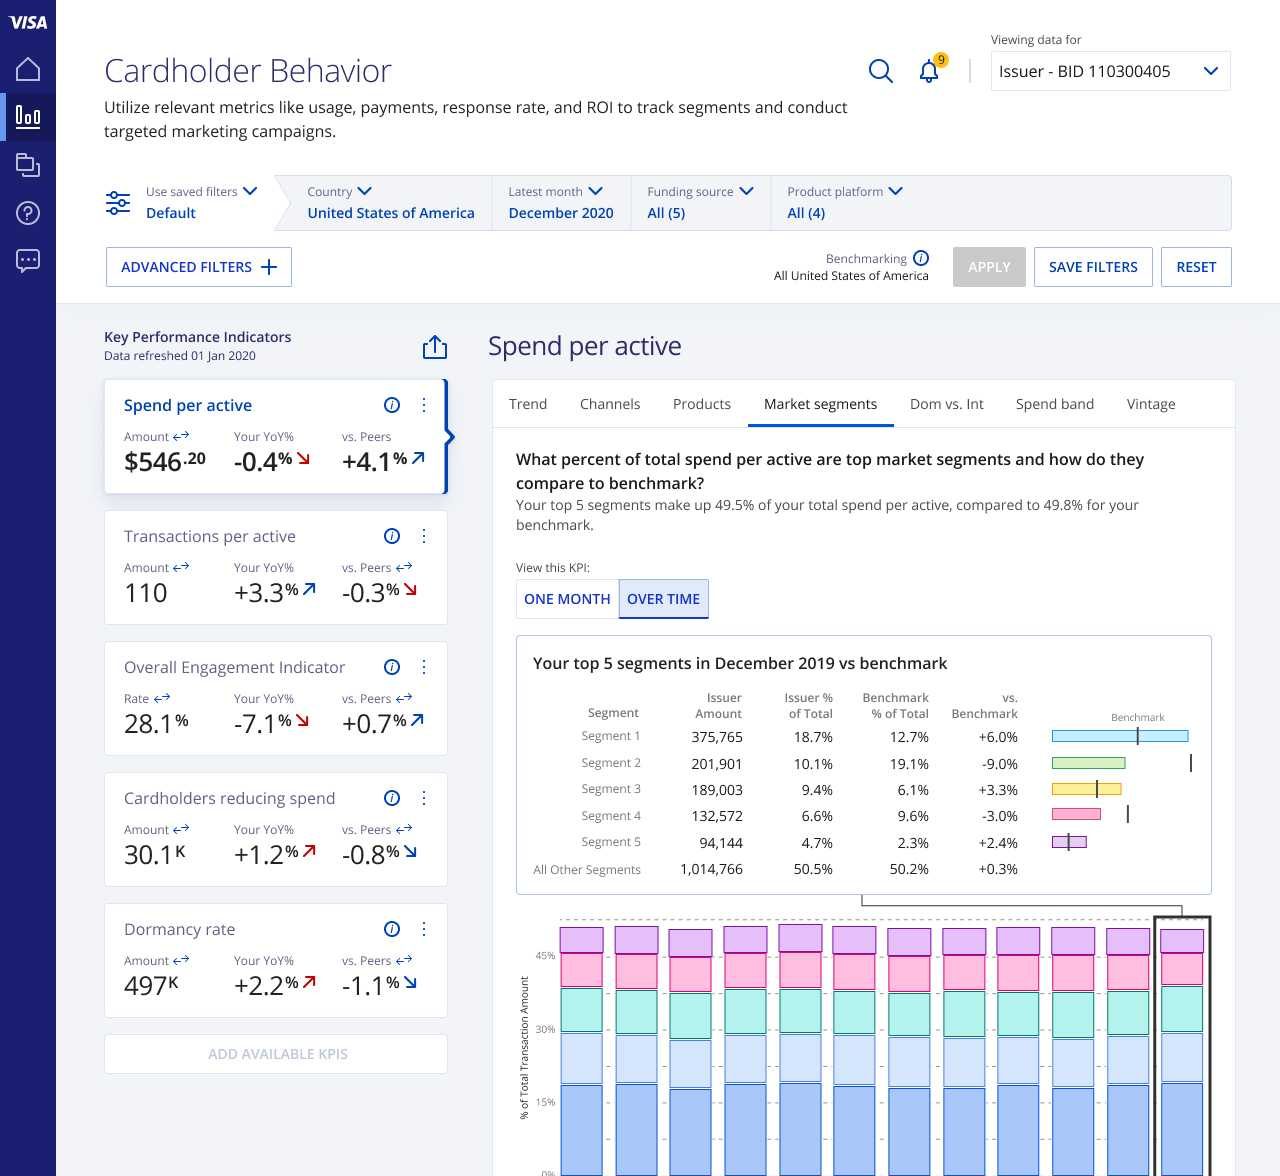
Every number,explained.
Analysts got depth on demand and an easy way out to their own tools. Executives got a page they could read and share. The final round came back extremely positive on look and feel, navigation and ease of use. What people still asked for was more definition: who exactly are my peers?